
2020 Listed Derivatives Review from Coex Partners
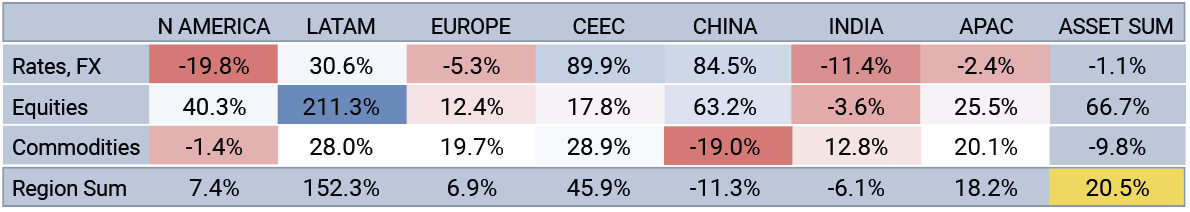
Sources: Bloomberg, COEX PartnersGlobal exchange traded derivative volumes tracked by COEX Partners in 2020 amounted to ~32.3 billion contracts – representing growth of 20.5% vs 2019.
The widely reported spike in retail account activity brought substantial volume uplift across equity markets. From ‘micro’ index futures to ETF options and across regions, volumes saw extraordinary gains. US short term rates markets spiked record volumes in March, with the CME Eurodollar future breaking 100 million contracts in a single month for the first time in its history. The Treasury futures complex hit a record 160 million contracts in February as Covid-19 emerged in the US, triggering the initial equity market rout and huge flight-to-quality flows.
It was a year of two distinct halves for interest rate markets, however. By August, short term rates markets were experiencing breathtaking year-on-year volume declines. Australia’s ASX24 90 day bill futures took a devastating hit once the RBA cut its Cash Rate Target to 0.1%. H2 volumes cratered to levels not seen since 1996 when the 90d Bills were still trading in open outcry pits. The contract ended the year down 51%. Q3 also saw the mighty Eurodollar future briefly dethroned by CME’s e-mini S&P500 as the world largest futures contract.
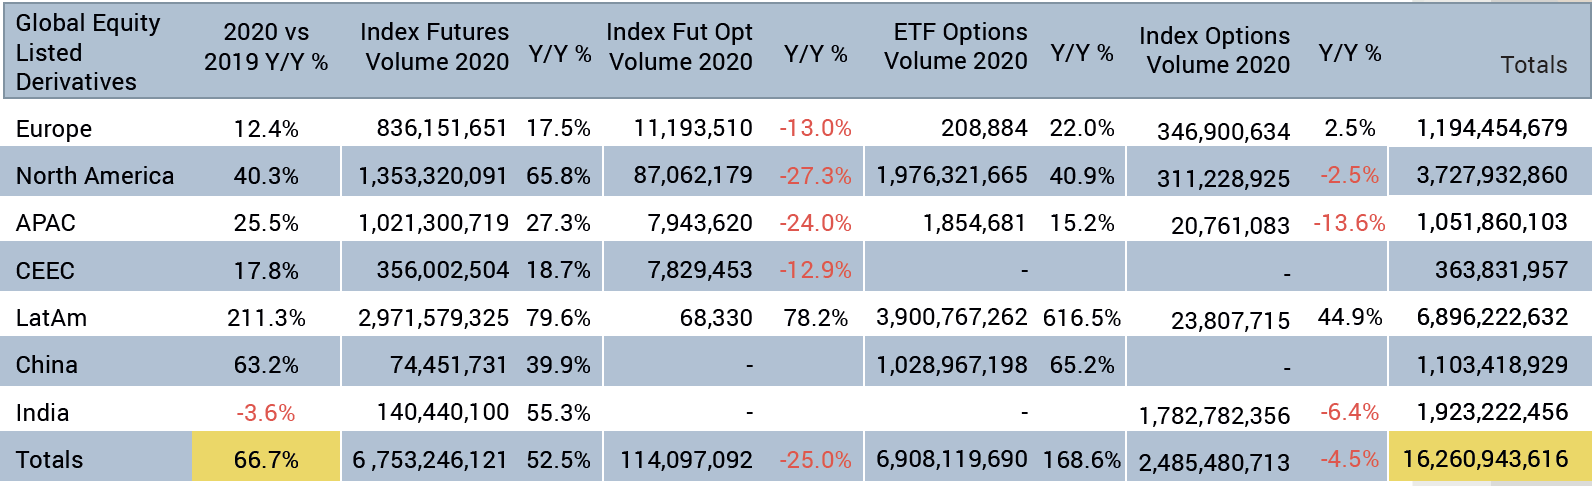
Global listed derivatives year-on-year volume growth.
Sources: Bloomberg, COEX Partners
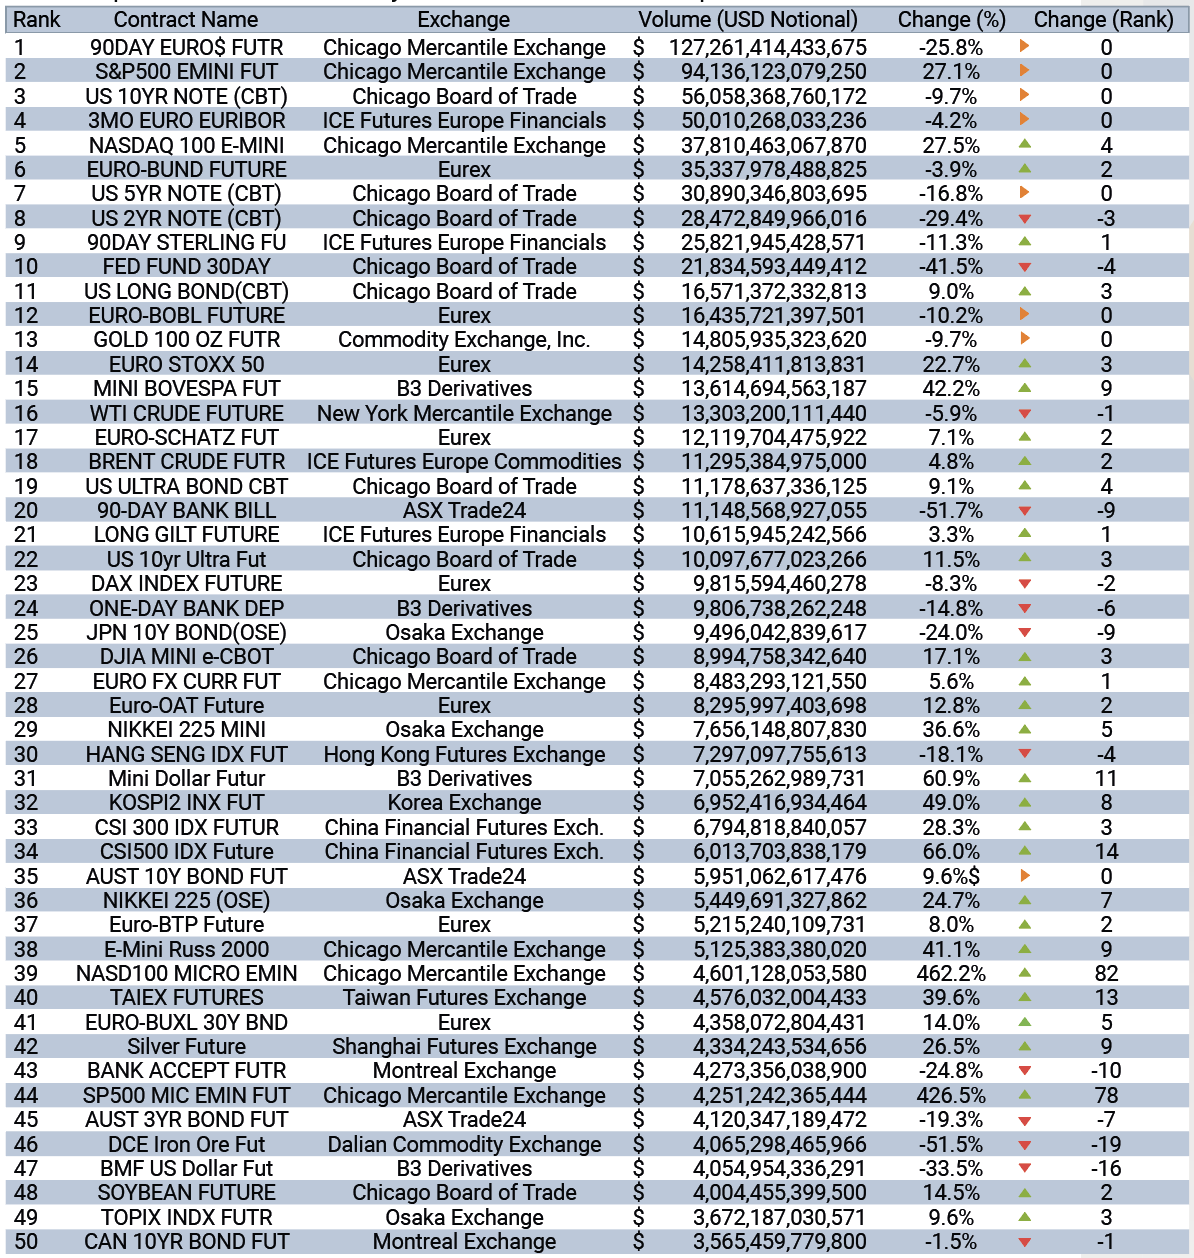
Global top 50 futures contracts by traded notional in USD equivalent 1
Sources: Bloomberg, COEX Partners
Small is beautiful
A perfect illustration of the sheer scale with which smaller investors impacted market volumes was the growth in CME micro equity index futures. In 2020, a little over two years after their extremely prescient launch, the CME micro e-mini Nasdaq future (~178 million contracts for the year) is trading more contracts than the long established and already hugely successful e-mini Nasdaq future (~146 million contracts). In USD notional terms, and despite its retail orientation, the micro contract traded more than 15% of the size of the more established e-mini in Q4.
US equity index futures growth was not limited to the micros. The e-mini S&P500, e-mini Nasdaq, e-mini Russell 2000 and CBT mini Dow Jones in aggregate added more than 162 million contracts to their 2019 tally – growth of 27.1%.
1 Traded Notional for non-USD contracts is estimated using the average relevant FX rate for the year
Libor-based STIRs: The beginning of the end
Thanks to huge volumes in the three months to April, the Eurodollar once again took the crown as the world’s largest futures contract (measured in USD notional). However, as the Fed hit its terminal rate for the year, activity declined sharply resulting in an overall 25.8% drop vs. 2019. Whilst this is at the extreme of historical annual declines, it is not unprecedented as 2009 and 2012 saw similar volume falls.
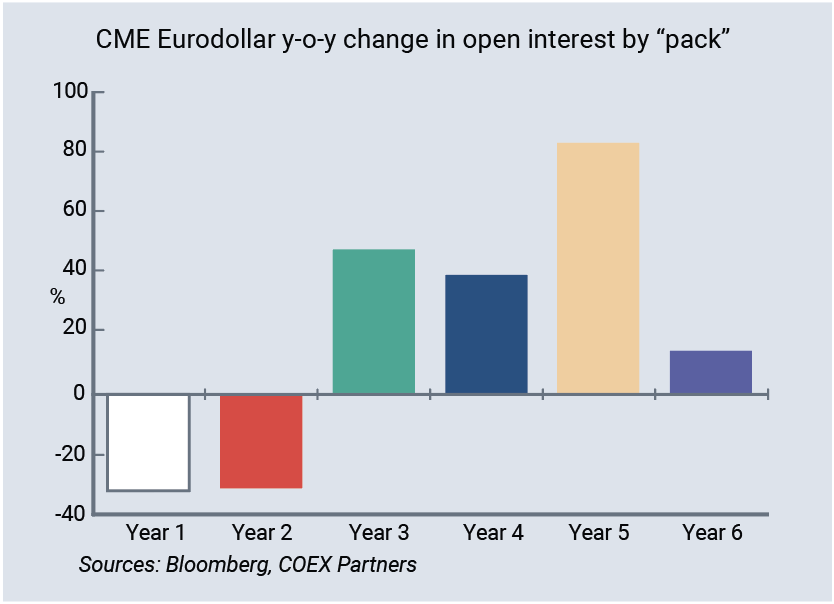
The sheer speed of the slowdown once the Fed Target Rate had reached its floor was extraordinary. Q3 volume declines were astonishing. Eurodollar futures fell 56% vs 2019, a loss of over 100 million contracts in absolute terms. The decline in Eurodollar, Eurodollar Mid-Curve and Eurodollar Weekly options amounted to a further 76 million contracts in aggregate. Adding in SOFR and Fed Fund Futures, the CME STIR products gave up 203 million contracts in Q3 2020 vs Q3 2019. The July futures tally of 22.9 million contracts was the lowest monthly total since December 2004. With the market anticipating that Covid-19 related, extraordinary monetary policy measures will remain in place until the US recovers from the pandemic’s economic impact, participants’ attention turned to the deferred contracts in H2. For example, open interest grew over 80% in the Golds. In absolute terms, however, OI growth in Greens, Blues and beyond was overwhelmed by the decline in Whites and Reds. Overall Eurodollar futures OI ended 2020 down 16.5% vs 2019.
A world without Libor
Libor based STIR contracts saw a partial recovery in Q4. A substantial portion of these volumes were predicated on technical updates related to the calculation period and implementation time-lines for Libor-fallback rates. Spreads based around the speculated implementation dates in Short Sterling & Eurodollars traded record volumes vs. historic volumes of equally deferred spreads.
As we enter 2021, reminiscent of 2009, Libor based STIR volatility/volumes may be constrained at the front end by low rate policies. Further along the strips, their volatility may decline as expectations grow that these contracts will converge to their respective fallback rates – a spread over the respective Adjusted RFR1. It was ironic that briefly in 2020, Fed expectations suppressed Libor based STIR growth, whilst the re-referencing process supported it.
1 Please refer to the BSIL / ISDA IBOR Fallback Rate Adjustments Rulebook for more information
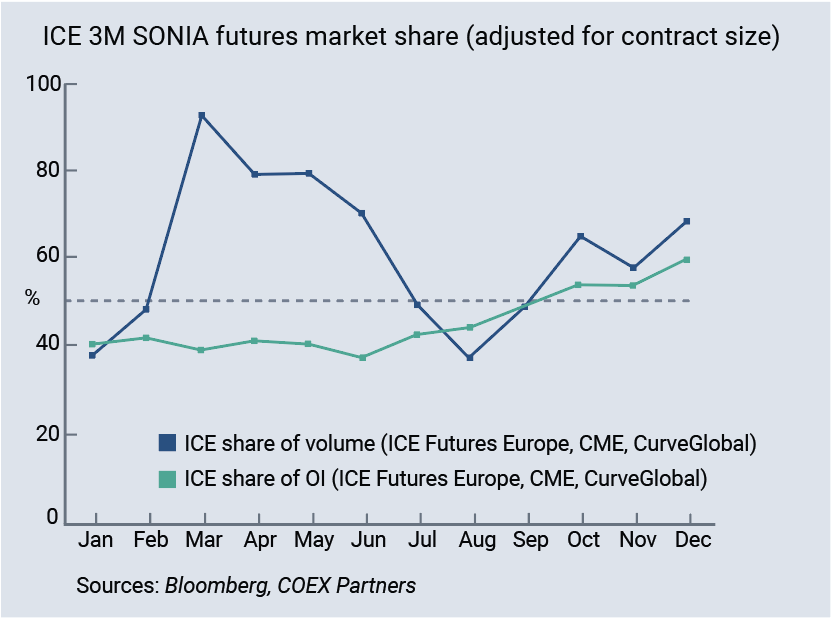
CME SOFR futures progress
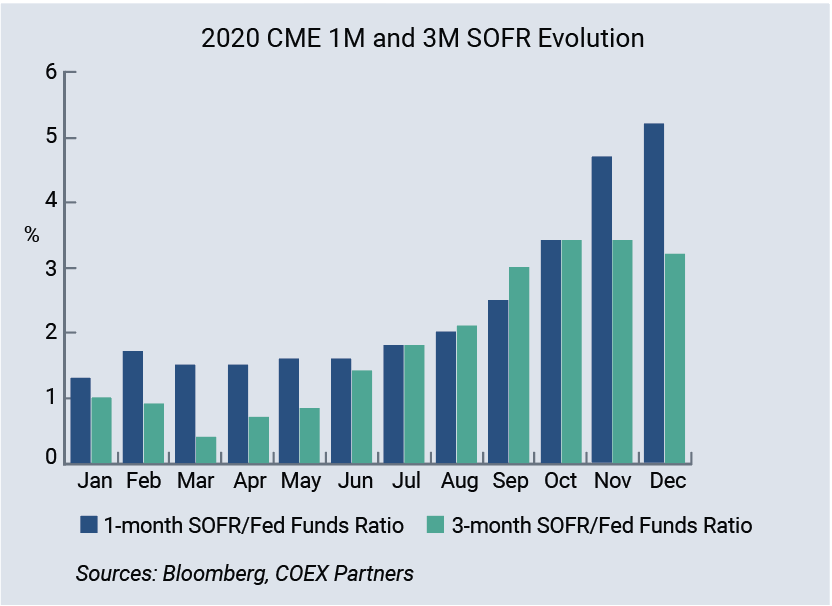
SOFR futures were surprisingly flat for most of the year. It was September before 3M SOFR took out the March 2019 monthly record with an 823k lot print for the month. Overall 3M SOFR gained 45.9%. In contract terms this represents 7.6 million lots for the year. 3M SOFR has big boots to fill as the Eurodollar future winds down in the coming years. Currently, it stands at a little over 3% in volume terms.
However, there is an argument to be made that, at the time of writing, 3M Eurodollar futures beyond the Jun ‘23 expiry already represent a proxy for the 3M SOFR future given that the market, for now, has started to price them more closely to the Libor fallback regime. Put another way, it is quite possible that the spread between 3M Eurodollars and 3M SOFR becomes increasingly stable in the deferred contracts such that they become almost interchangeable up until the roll market between SOFR/E$ becomes more active. This will make for an easier shift in OI. 1M SOFR also gained 34% Y/Y to 5.22m lots but with the Fed on hold it was no surprise to see volumes decline 27% in Q4 vs 2019 – a win relative to the 76% decline in Fed Funds for the quarter!
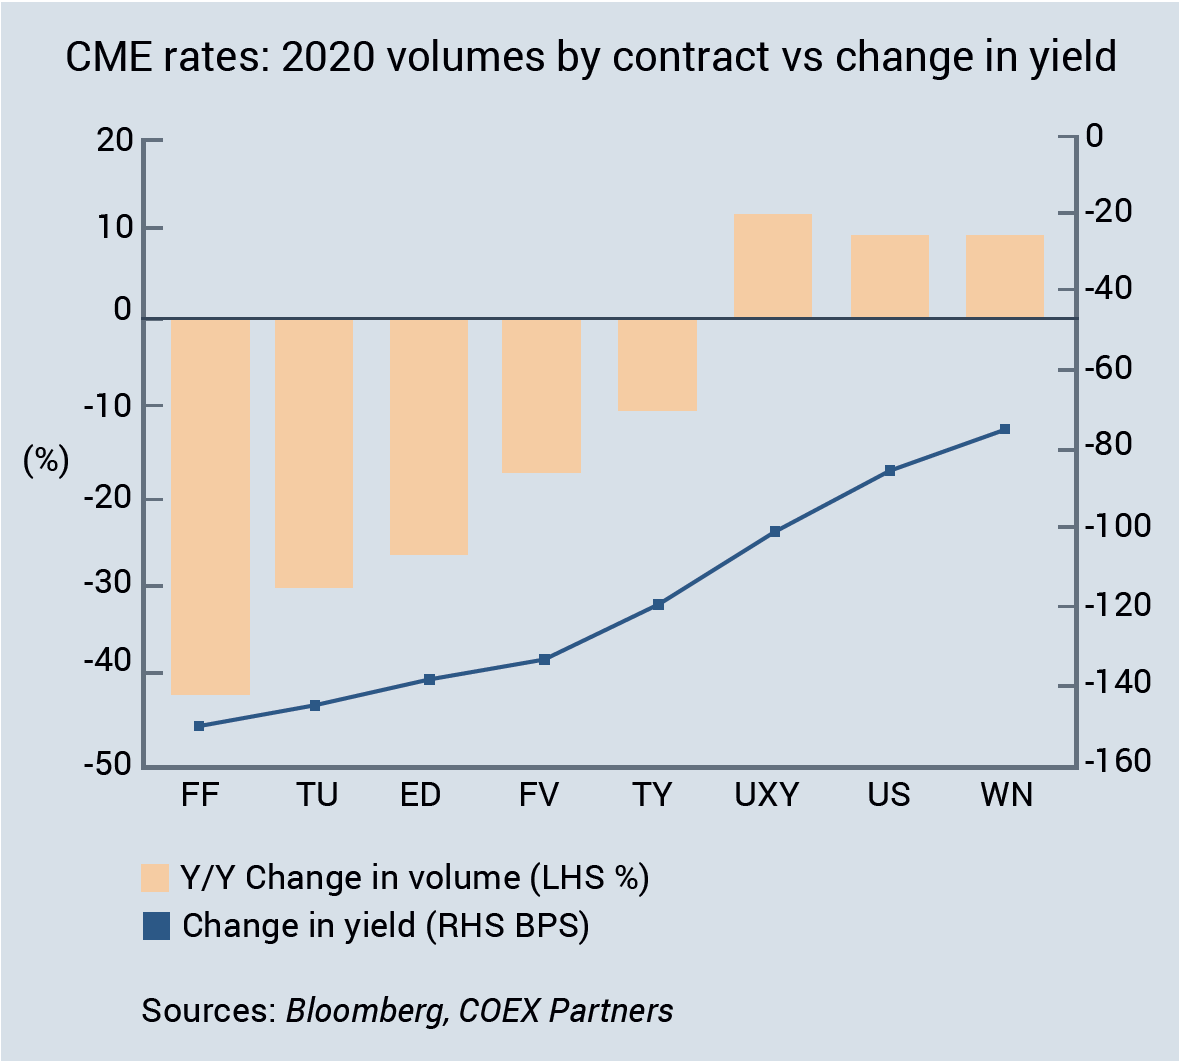
Fixed income: Yield begets volume
After a disorderly Q1, volumes chased yield along the US treasury curve.
The outbreak of Covid-19 wrought substantial volatility in US treasury and funding markets in February and March. The initial
wave of buying took 2yr yields from 1.38% to 0.245% in just 13 trading sessions. CME 2Yr, 10yr & Ultra Long Bonds posted all time historic
volume highs in February whilst 5Yr, Ultra10s and Long Bonds posted their second best ever months.
The initial scale of demand overwhelmed dealing desk’ ability to provide liquidity in OTR bonds, forcing investor flows into futures (just as the H0/M0 roll was underway). The resulting futures outperformance was compounded as in turn significant basis unwinds were triggered.
TYM0 implied repo-to-delivery more than doubled in the second week of March leading to FRBNY intervention. Further relief came
on April 1st as the FRS Board announced the temporary exclusion of US Treasuries and Deposits at Federal Reserve Banks from the SLR denominator.
April saw a substantially compressed trading range and an immediate decline in volumes. With a backdrop of strong central bank forward guidance, the search for yield began. By December 2020, the respective volume performance at each point on the CME US Treasury futures curve had become highly correlated (R2 = 90%) to the respective change in yield (see chart to right). Overall, bond contracts at CME/CBT ended the year down 14.3% vs 2019.
Brazil, China and India
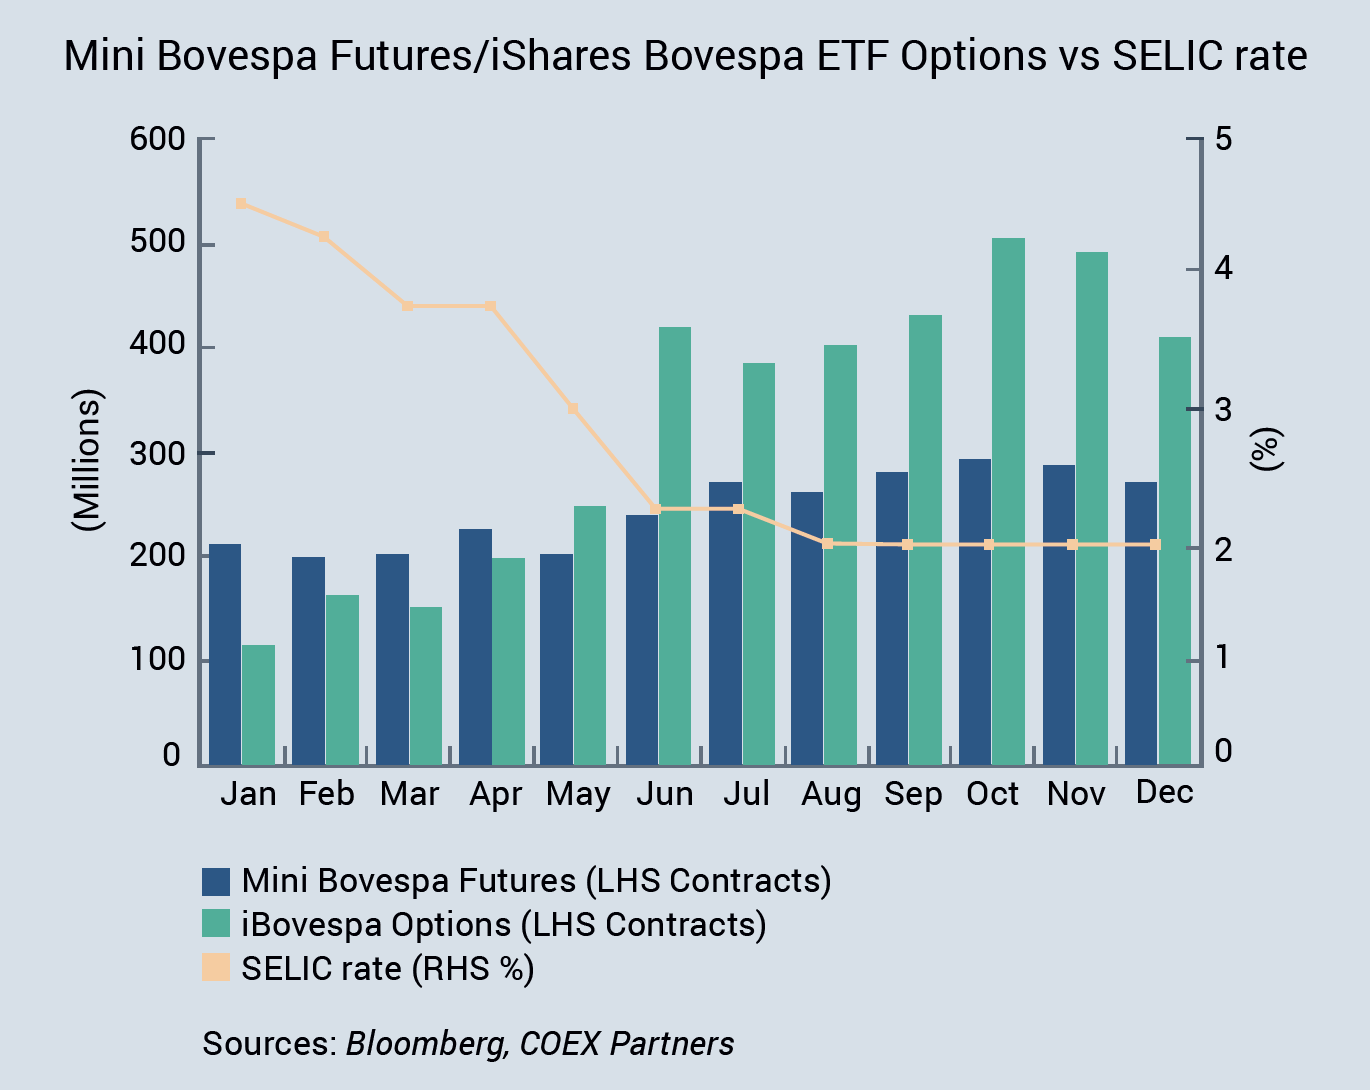
Brasil's B3 dazzled again 2020. In USD terms, LatAm equity returns remained negative into year-end as local Central Bank action to cushion the impact of the pandemic accelerated the softening of local currencies in H1. The Central Bank of Brasil’s easing of the SELIC target rate to record lows was accompanied by record volumes in the B3 Derivatives DI futures.
The DIs posted 71.1 million contracts in March (just 8 million contracts shy of the whole of Q1 2019) and finished the year +8% (with the base effect of the huge H2 of 2019 limiting the Y/Y gains). Local investors appeared to embrace B3 derivatives mini-Dollar futures as a tool to manage 2020’s FX volatility; volumes more than doubled for the year.
The B3 mini-Dollar now ranks as the 31st largest contract by USD notional in our rankings. With an unprecedented low-rate backdrop, Brazil equity volume growth was nothing short of spectacular; B3 Equity iShares Bovespa ETF Options delivered 6x growth to 3.9 billion contracts.
B3 Derivatives’ mini-Bovespa futures came in at 2.9 billion contracts for the year - a pickup of 80% on 2019. The Brazilian market reeacted the broad retail growth narrative that underpinned much of the new volume that hit global exchanges in 2020. B3 released data in December showing that the number of accounts at B3 passed the 3.2 million mark at the beginning of October. According to the exchange, over 2 million accounts were opened in just one year to April 2020. In common with the global, Covid-19 era retail growth phenomenon, B3 also reported that its new crop of participants is young - averaging 32 years old, is more financially educated as a result of “the democratization of access to information”, and more tolerant of volatility.
China equity index futures supplant commodities as recovery proxy
Chinese onshore markets were no exception to the global equity derivatives volume story. Aer the CSI300 futures reappearance last year in the global top 50 (following re-liberalization of trading rules), the contract posted a further 27% jump.
The small cap CFFEX CSI500 contract did even better, gaining 14 places in our ranking estimate with 66% growth. That said, Chinese markets declined overall as the largest commodity contracts struggled despite the price recovery. China’s star of 2019, DCE Iron Ore, suffered a 52% volume decline, SFE (Shanghai Futures Exchange) Nickel gave up 44% and SIEE Crude Oil volumes fell 41%.
China’s pause in 2020 in the context of buoyant global markets, saw its share of traded USD notional amongst the top 50 contracts halve to 1.4%. However, China remains very present in the ‘mittelstand’, with 12 of the next largest 50 contracts in the global rankings – amounting to 5.2% of the USD traded notional.
India sees strong trading in equities, FX and precious metals
NSE Niy 50 Index futures recorded their highest notional volumes for ve years with a 34.4% pickup on 2019 to 54.7 million contracts. The Nifty Bank Index leap-frogged the Nifty having posted 80% year on year growth to 76.2 million contracts.
Whilst the NSE’s bellwether INR/USD currency futures and options came in with their fourth consecutive year of growth to 849 million contracts, NSE’s currency complex was 6% weaker overall. In keeping with the theme, MCI benefitted from huge retail growth; Micro Silver and Gold ‘Petal’ futures being +216% and +520% respectively.
Agriculture focused NCDE ended the year 34% lower. As in other markets, equities thrived with Nifty Index options volumes surging 56%, though NSEBANK Index options declines erased the overall gain for the NSE indices.
Index futures and ETF options drive growth
Growth in US ETF options was very concentrated and partially offset by SPX Index options. Headline growth in US ETF options volume was impressive with a 40.4% improvement on 2019. It is worth noting, however, that the largest three ETF options by volume (SPY, QQQ & IWM) accounted for nearly all the growth within the universe of ~300 ETFs that we monitor for this analysis. SPY, QQQ & IWM options generated 548.2 million of the total 565.2 million uptick seen in 2020. It is also worth pointing out that the decline in volume of the SPX Cash Index options represents 10 times the volume in SPY equivalents. The ~10 million contract decline in SPX Index is worth about 20% of the growth in its SPY counterpart.
Once again, US index futures growth was flattered by extraordinary gains in CME/CBT micro e-mini Index Futures. Hot on the heels of 87m contracts generated in just eight months of their existence in 2019, the CME/CBT Micro Emini Index futures hit the ground running in 2020.
Their tally for the year came to 461 million contracts – growth of 426%. In contract volume terms, the micro e-mini S&P future became the second largest index contract at the exchange, easily surpassing the e-mini Nasdaq future. Of course, at 1/10th the size of their e-mini cousins, the picture changes dramatically in notional terms.
Adjusting the micro contracts into e-mini equivalents reduces North American Index Futures growth to a, still very respectable, 27%. Micro options launched in Q3. We watch with interest to see if they are able to make inroads into the SPY, QQQ, IWM & DIA ETF options’ increasingly dominant market share. Meanwhile at ICE Futures US, the successful MSCI EM index future posted its 11th consecutive year of growth (13.8%).
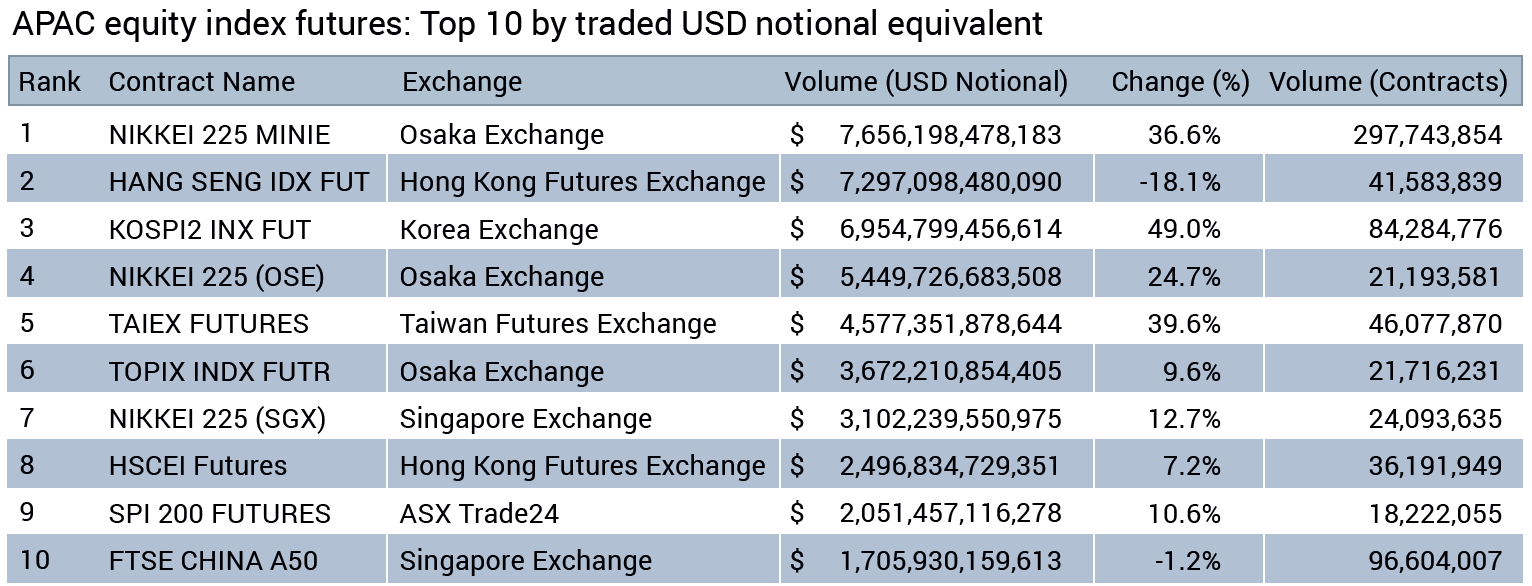
APAC / EMEA Equity Indices
Whilst the top APAC Index contracts remain more broadly distributed by country than is the case for Europe, there was a significant shift at the top of our rankings as the Osaka Nikkei 225 Mini contract overtook HKFEs Hang Seng as APACs largest contract by traded notional
(USD equivalent).
In Europe, the Eurex Eurostoxx Future comfortably retained its top ranking by notional, adding 20% vs 2019. Most notably from a growth perspective, the Eurex Mini Dax future added 48% on the year to 16.9 million contracts, lifting the contract to 6th place in the EMEA Index Futures Leaderboard.
Finally, an honourable mention to Eurex's Eurostoxx 50 Index Total Return futures with year on year of growth of 169% to a hair short of 10 million contracts for 2020."
Disclaimer
This report was prepared by COEX Partners, a division of Tullett Prebon Financial Services LLC (Tullett Prebon), an introducing broker registered with the U.S. Commodity Futures Trading Commission and a broker-dealer registered with the U.S. Securities and Exchange Commission. Tullett Prebon is a member of the Financial Industry Regulatory Authority, Inc. (FINRA) and the National Futures Association (NFA). The information contained in and accompanying this communication may be confidential, subject to a legal privilege, or otherwise protected from disclosure, and is intended solely for the use of the intended recipients. If you are not the intended recipient of this communication, please delete and destroy all copies in your possession, notify the sender that you have received this communication in error, and note that any review or dissemination of, or the taking of any action in reliance on, this communication is expressly prohibited. All electronic communications may be reviewed by authorized personnel and may be provided to regulatory authorities or others with a legal right to access such information. Instant message communications may contain computer viruses or other defects, may not be accurately replicated on other systems, or may be intercepted, deleted or interfered with without the knowledge of the sender or the intended recipient. The information contained in and accompanying this communication is not, and should not be construed as, an offer, bid, or solicitation in relation to any financial instrument or as an official confirmation of any transaction. To the extent any of the information contained in and accompanying this communication reflects pricing information, such pricing information is purely indicative, and Tullett Prebon makes no warranty or representation that such pricing information reflects prices at which transactions may be or have been effected. Further, Tullett Prebon makes no representation, warranty or guarantee as to, and shall not be responsible for, the accuracy or completeness of any information contained in and accompanying this communication. None of the information in this message or any attachments hereto is intended to be research for the receiver. Opinions expressed herein are statements only as of the date indicated and are not given or endorsed by Tullett Prebon unless otherwise indicated by an authorized representative. Trading in futures, or options on futures or other derivatives entails significant risks which must be understood prior to trading and may not be appropriate for all investors. Each prospective investor should carefully consider whether futures or options on futures trading is suitable in light of their financial condition. Past performance of actual trades or strategies cited herein is not necessarily indicative of future performance.
To read the full report click here
In this special report, COEX Partners analyses exchange traded derivatives volumes in 2020. COEX tracks traded USD equivalent notional as well contract volumes in over 2,000 contracts across 75 exchanges. The figures in this report are based on that data.


